20 november 2020
This mapping application will be used as a showcase on Science Day on November 22, 2020.
With the updated version you can now compare 2 municipalities for 2 different years. This way you can easily observe the increase or decrease of a certain landuse between 2017 and 2019 for the same municipality. Via the "share" icon, citizens or municipalities can easily share information about their municipality with others.
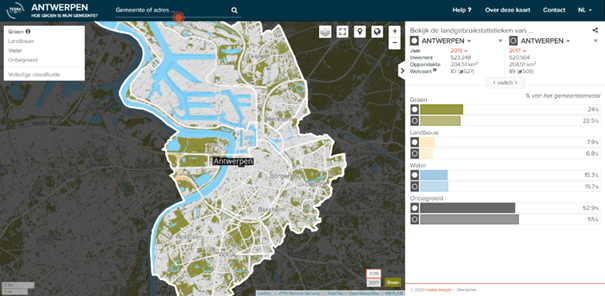
The map is highly interactive and shows the differences between the different municipalities for the 4 major land use classes: green, agriculture, water and sealing area. Each municipality is ranked according to the percentage of the land use area respectively and according to welfare index.
When zooming in on the map, the classification is also shown in detail and you can locate the respective land uses on the map. Zooming out gives an idea of the ratio per class for each municipality on Belgian territory.

This map is available in Dutch, French and English. In addition, it is accessible via 2 different urls: Hoegroenismijngemeente.be or estcequemacommuneestverte.be. Completely tailored to Belgium.
The map is used as a demonstration of the use of modern satellite images from the European Copernicus program. For the Belgian territory, the raw data from the Sentinel satellites is offered by the European Space Agency (ESA) and further processed by VITO (on behalf of BELSPO) under the Terrascope flag. This with the aim of offering ready-to-use data, information and services to Belgian users free of charge.
Some technical background:
For the first map of 2017 a classification between water, vegetated and sealed areas was based on the Normalized Differential Vegetation Index. The vegetated areas were split later on, in vegetation and agricultural areas.
For the second map of 2019, satellite images were used next to reference data sets (e.g. digital elevation model) and training data to classify 10 classes of land cover using artificial intelligence methodologies. This result was simplified to the 4 classes from the 2017 map.
This map application was developed on behalf of VITO.


